IMHO VI: Statistics for online advertisement
Description
Client feedback
We would like to note the high level of expertise and competence of Gramant’s engineers in solving complex problems, efficiency and quality of their work.
In Gramant we see a reliable partner, which is able on the highest professional level to provide solution to a task of any complexity and guarantee a high quality of the software from technical and users point of view.
A. A. Novozhilov, Head of Business Development «Media-Net»

The Stats system analyzes results of Internet advertisement campaigns. It has been developed for IMHO VI (Media-Net), which is a part of Video International Group. Media-Net is one of the largest companies in the Russian Internet advertisement market.
The Media-Net is responsible for placing ads on first-rate Russian Internet sites, such as yandex.ru, mail.ru, afisha.ru, etc. The daily amount of transactions average to tens of millions. To analyze the results of ongoing campaigns a user friendly system is needed, which can display interests and preferences of various Internet resource users. This information allows advertisers to fine-tune their advertisement campaigns and increase the efficiency of Internet advertisement.
Due to the huge amount of data, its processing can take up to few hours and sometimes even days.
The Stats system allows users to view various slices of data, particularly to conduct coverage analysis and unique visitors’ analysis, generate reports in the background with consequent user notification and export the results into Excel. The system supports users access control, also supports an OEM mode, which allows other advertising agencies to provide data to their customers.
Technologies
- Platform — Java
- DBMS — Oracle
- OS — Linux
Case study
Process
| Project: | «Statistics system 1.0» |
| Client: | Media-Net |
| Period: | April 2008 – June 2008 |
| Technologies: | J2SE, Oracle, Wicket |
The client for the system was Media-Net. Media-Net is one of the leaders on the Internet-advertising market in Russia and had exclusive license for DoubleClick DART Enterprise for Russian market. Media-Net through DART Enterprise offers banner-ad placement services on major Russian Internet sites to advertisers.
The client expressed an interest in creating a statistics system that allows the user to receive various reports on the results of advertising campaigns. The client uses its own DART Enterprise for displaying ads. The DART system registers more than 6 million events daily.
The DART system supports a certain set of reports; however, they don’t entirely satisfy the client in terms of analyzing results of advertising campaign. The client defined the desired set of reports which were to be implemented. Data for the reports was to be extracted from the existing DART infrastructure.
“Number of displays of and clicks on Banner X on site Y last week” can serve as an example of the most basic report. Statistics system users are Media-Net employees and clients. Generating various reports, advertiser clients, who have ordered an advertising campaign to be implemented, use the statistics system to audit the number of displays and clicks on a banner and to analyse the effectiveness of advertising sites. The analysis of the advertising sites’ effectiveness allows the advertisers to better place ads in the future.
Project start
Specifications were created by us together with the client. The list and contents of reports were approved. The system was to have a web interface, be programmed in java, and use Oracle as the DBMS. The design and layout of the system’s screens was done by a professional designer from our pool; programming, testing and implementation was done by our team.
We had to solve the following important problems at the start of the project:
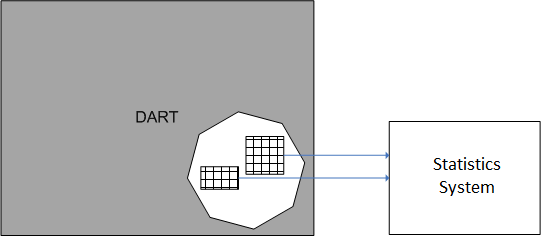
Problem 1. How to extract data from the DART system.
Documentation on DART contained no description of a mechanism for exporting data or an API, with which we would have been able to extract data on banner clicks and impressions. In terms of receiving raw data on clicks/impressions, DART was a black box. Together with the client’s technical specialists, a solution was found—extract data directly from special tables in the DART database.
Problem 2. Ensure that all of the client-proposed reports could be implemented.
The client described the purpose of the reports in “business terms”. Our team of developers was to ensure that they would be able to implement each report. For each report, we evaluated the possibility of creating an SQL request for extracting data from the database. Using the team’s experience in creating reporting services for other banner systems, we likewise recommended several sets of reports which seemed useful to the client in terms of ad campaign analysis. The result of this was the confirmed list of reports with a description of their functions.
The team managed to create SQL requests for all of the reports, and each one was created using only one request. Work was done on optimizing requests; to speed up the process, indices were created in the database and several requests were rewritten after analyzing their cost.
Problem 3. How to organize interaction with DART system in load-safe mode.
Since the statistics system uses the DART system database, it was necessary to organize this interaction in such a way so that it wouldn’t disrupt DART processes. The DART system is responsible for the banner display and statistics gathering function; any interruptions to the system’s operations would mean inevitable financial and reputational damage for the client. Two kind of information on clicks and impressions are gathered in the DART system: that with information on the user, and that without. User information corresponds to a unique identifier of the user’s browser. All reporting in the system can be divided into two categories depending on whether or not it uses information on users.
An example of a report that uses user information:
Finding the number of different users who saw a banner from a particular advertising campaign for a specific period of time.
An example of reporting that doesn’t use user information:
The general number of displays for all banners from a particular advertising campaign for a specific period of time.
Both kinds of data (with and without user information) are saved to the DART system in separate tables. The amount of data without user information is substantially less (roughly 2000 times).
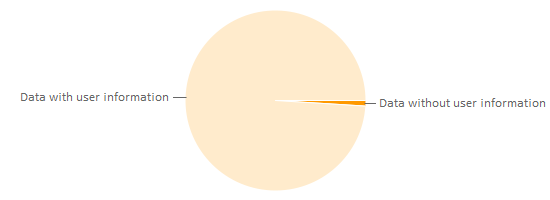
In one day, a table with user information grows by 6-7 million rows; tables without user information grows just by 30 thousand lines. Accordingly, the amount of time it takes to fulfill a query differs. Queries to tables without user information are processed quickly (less than 5 seconds), whereas queries to tables with user information take a long time to process (more than 10 minutes). The long query time leads to two problems:
— Statistics system users will be dissatisfied with the long wait for results
— There is a risk of burdening the DART database with queries from the statistics system and impairing DART systems operations.
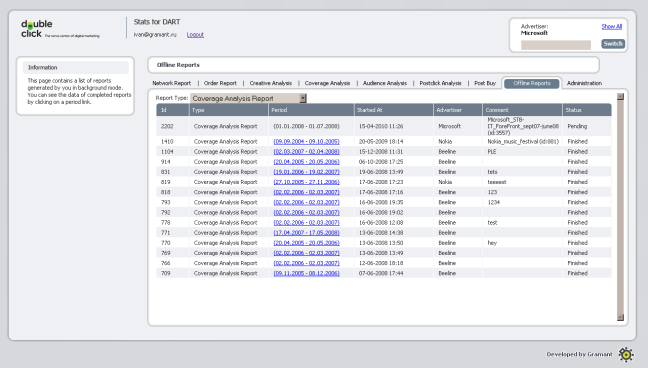
A mechanism for compiling reports in “background mode” was created to solve the first problem. The name “offline reporting” was given to reporting services which uses user information. When requesting an offline report, the user sees that the report enters the queue of pending offline reports. After the report is processed, the user receives notification by mail that the report is ready. The user’s work is not blocked when an offline report has been requested; the user can use the system, generate on-line reports (query tables without user information), and look over the results of processed offline reports.
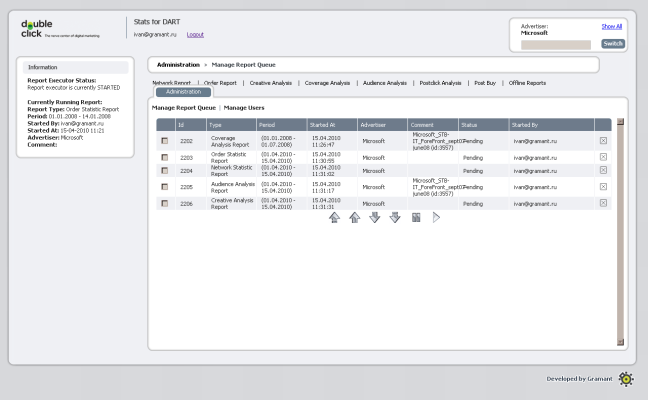
An offline report queue was created to solve the second problem. The mechanism for performing offline reporting in background mode chooses the first offline report from the list of unprepared reports. The selection of the next report from the queue only occurs after the previous offline report has been compiled. A special user with the role of “report queue administrator” can rearrange offline reports that are in the queue.
Having resolved the key issues, the team could begin development.
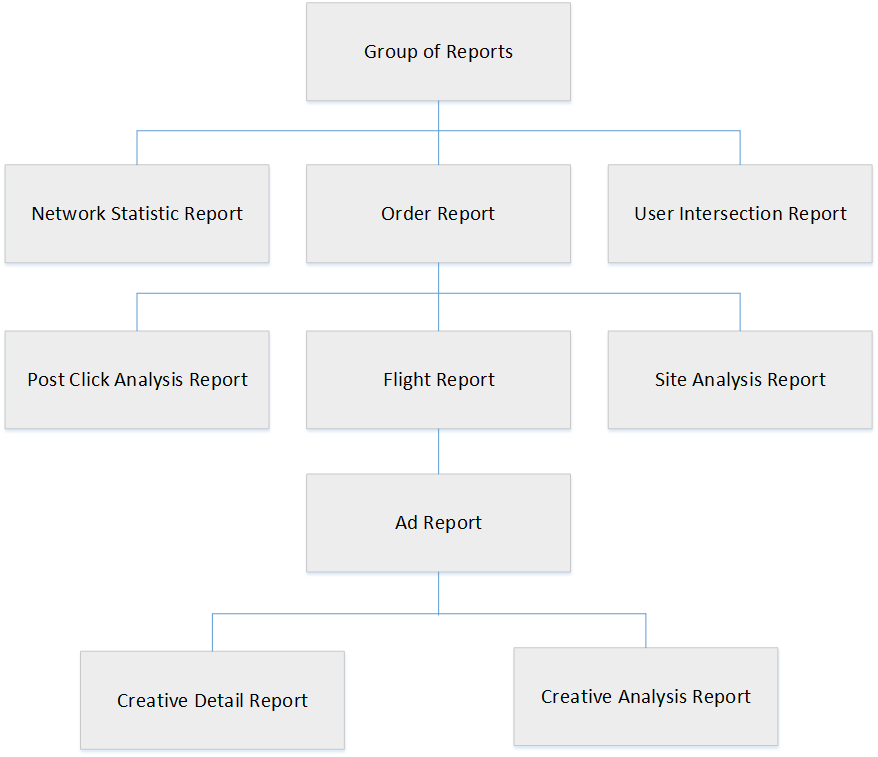
One of the most important features of the system was reporting. The reporting architecture in the statistics systems resembles following image:
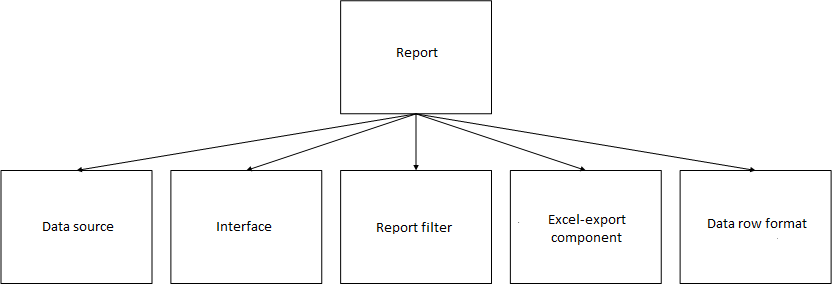
— The data source stores an SQL request for a report and processes the database’s response
— The interface is a template of screens with report results and filter panels
— The report filter is a set of parameters for filtering a report
— The Excel-export component is responsible for exporting results into an excel file
— The data row format describes the types of data in the lines of the report’s results and is needed for saving the results of compiled offline reports to the hard disk.
The reporting component architecture allows new reports to be added to the system with relative ease, making the developer focus only on the report’s components and not touch the system’s existing code. In the following versions of the system, the client wanted to add new reports, and this work was successfully carried out thanks to the well-designed reporting architecture. Thanks to the well thought-out system interface, adding new reports didn’t demand significant interface costs or reworking when adding a new report.
Within the framework of the demands, a mechanism for exporting reports was implemented, which allowed results to be saved from the system’s web interface to an Excel spreadsheet.
The first version of the system was developed on time, and the client was happy with the results (reviews). We’re glad the client requested this system. Collaboration with Media-Net has continued and several versions of the statistics system have been created with new functions:
— Version 1: Reports (online/offline), queue and offline reporting mechanism, export to Excel.
— Version 1.1: Role system. Access permissions. Administrative interface. Fluid layout.
— Version 1.2: New reports.
— Version 1.3: Offline report queue management.
— Version 2: New report, UI alterations.
— Version 2.1: Unique clicks column.
— Version 2.2: PostClick reports.
— Version 2.2: PostBuy reports.